- Lesson 1 Shells, subshells, and orbitals
- Lesson 2 Introduction to electron configurations
- Lesson 3 Noble gas configuration
- Lesson 4 Electron configurations for the first period
- Lesson 5 Electron configurations for the second period
- Lesson 6 Electron configurations for the third and fourth periods
- Lesson 7 Electron configurations of the 3d transition metals
- Lesson 8 Paramagnetism and diamagnetism
- Lesson 9 The Aufbau principle
- Lesson 10 Valence electrons
- Lesson 11 Valence electrons and ionic compounds
- Lesson 12 Introduction to photoelectron spectroscopy
- Lesson 13 Photoelectron spectroscopy
Shells, subshells, and orbitals
Introduction to electron configurations
Noble gas configuration
Electron configurations for the first period
Electron configurations for the second period
Electron configurations for the third and fourth periods
Electron configurations of the 3d transition metals
Paramagnetism and diamagnetism
The Aufbau principle
Valence electrons
Valence electrons and ionic compounds
Introduction to photoelectron spectroscopy
Photoelectron spectroscopy
Key points
Photoelectron spectroscopy (PES) is an experimental technique used to determine the relative energies of electrons in atoms and molecules.
Photoelectron spectrometers work by ionizing samples using high-energy radiation (such as UV or x-rays) and then measuring the kinetic energies (\[\text{KE}\]) of the ejected electrons.
Given the energy of the incident radiation (\[h\nu\]) and the \[\text{KE}\] of the photoelectrons, the binding energy (\[\text{BE}\]) of each ejected electron can be calculated using the following equation: \[\text{BE}=h\nu-\text{KE}_{\text{electron}}\]
A PES spectrum is a graph of photoelectron count vs. binding energy.
The peaks in a PES spectrum correspond to electrons in different subshells of an atom. The peaks with the lowest binding energies correspond to valence electrons, while the peaks with higher binding energies correspond to core electrons.
Introduction: What is photoelectron spectroscopy?
Photoelectron spectroscopy (PES) is an experimental technique that measures the relative energies of electrons in atoms and molecules. Scientists often use PES to study the elemental composition of materials or to characterize bonding in molecules. In this article, however, we’re going to use PES to deepen our understanding of atomic structure: by looking at PES data for pure samples of elements, we’ll see how photoelectron spectroscopy provides direct support for the concepts of electron shells and subshells, electron configurations, and more.
The basics of photoelectron spectroscopy
Photoelectron spectroscopy is based on the photoelectric effect, a physical phenomenon first characterized by Albert Einstein in 1905. The photoelectric effect is as follows: when electrons in a metal are exposed to light of sufficient radiation, the electrons are ejected from the metal surface. If we know the kinetic energy of the ejected electrons (known as photoelectrons) and the energy of the incident radiation, we can calculate the energy of the electrons in the solid metal. (For more details, check out this article on the photoelectric effect.)
Photoelectron spectroscopy simply applies the photoelectric effect to free atoms or molecules instead of metals. In PES, a sample is bombarded with high-energy radiation, usually UV or X-ray, which causes electrons to be ejected from the sample. The ejected electrons travel from the sample to an energy analyzer, where their kinetic energies are recorded, and then to a detector, which counts the number of photoelectrons at various kinetic energies. A simplified diagram of this process is shown below.
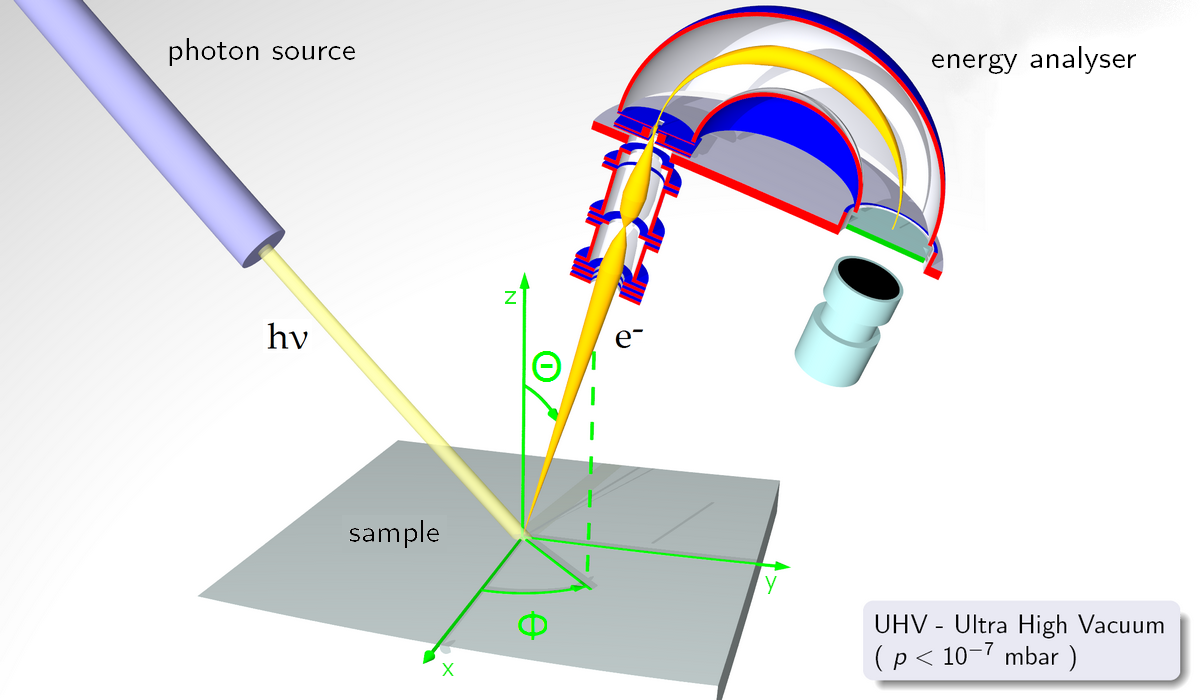
A diagram of a photoelectron spectrometer. UV or X-ray radiation is used to ionize a sample, and the kinetic energies of the ejected electrons are recorded by the energy analyzer. Image credit: "ARPESgeneral" by Saiht on Wikimedia Commons, CCO 1.0.
The energy required to eject an electron from the sample is known as the electron’s ionization energy or binding energy. We know the energy of the radiation (\[h\nu\]) used to eject the electron. So, by measuring the kinetic energy of the photoelectron (\[\text{KE}_\text{electron}\]), we can calculate the binding energy (\[\text{BE}\]) of the electron in the sample:
\[\text{BE}=h\nu-\text{KE}_\text{electron}\]
Show me how you derived this equation.
The binding energy of an electron in an atom depends on its location around the nucleus. Electrons in the outermost shell (valence electrons) are more shielded and farther from the nucleus on average, so they have the lowest binding energies of all of the electrons in an atom. In contrast, electrons in inner shells (core electrons) are less shielded and closer to the nucleus on average, so they have higher binding energies. As we’ll see in the next section, understanding the relationship between an electron's binding energy and its location is essential for the interpretation of PES data.
Analyzing PES spectra
Data from PES experiments is obtained as plots of photoelectron count vs. binding energy, with binding energy usually expressed in units of electron volts (\[\text{eV}\]) or megajoules (\[\text{MJ}\]) per mole.
To help with data interpretation, PES data for elements is often plotted so that binding energy decreases as you move right along the horizontal axis, allowing us to think of the origin as representing the nucleus of the atom. Also note that the energy scale is logarithmic.
A typical PES spectrum features peaks at different binding energies. Because electrons in a particular subshell of an atom have the same binding energy, each of these peaks corresponds to electrons in a different subshell. The binding energy of a peak tells us how much energy is required to remove an electron from the subshell, and the intensity of the peak tells us the relative number of electrons in the subshell.
To illustrate, let's look at some PES data. Real PES data is messy and often difficult to interpret by non-experts, so we're going to be examining idealized spectra in which the data has been simplified so as to be more understandable.
PES spectrum of lithium
Let's start with the idealized PES spectrum for lithium, \[\ce{Li}\]. For reference, the ground-state electron configuration for lithium is \[1s^22s^1\].
How do we find an element's electron configuration?

\[\small{1}\]\[\small{10}\]\[\small{100}\]Binding energy (MJ/mol)Relative number
of electrons\[\small{0}\]
The idealized PES spectrum of lithium.
The PES spectrum shows two peaks, which represent electrons in the \[2\] different subshells of lithium (\[1s\] and \[2s\]). The peak that is closer to the origin is twice as intense as the farther peak. The \[1s\] subshell of lithium contains twice as many electrons as the \[2s\] subshell (\[2\] vs. \[1\]), so the peak closer to the origin must correspond to lithium's \[1s\] subshell.
This also makes sense in terms of binding energies: We know that the electrons in the \[1s\] subshell of lithium are closer to the nucleus and less shielded than the electron in the \[2s\] subshell. As a result, the \[1s\] electrons require more energy to remove. This is consistent with the fact that the \[1s\] peak in the PES spectrum is at a higher binding energy.
Note that the binding energy of lithium's \[2s\] peak is equal to the first ionization energy of lithium–that is, the amount of energy is required to remove the outermost or least bound electron from a lithium atom. However, the binding energy of the \[1s\] peak is not equal to the second ionization energy of lithium. Once the first electron is removed from lithium, the \[1s\] electrons will be held even more tightly by the nucleus, increasing the binding energy of these electrons.
PES spectrum of oxygen
Next, let's consider an element with more electrons. Below is the idealized PES spectrum for oxygen, \[\text{O}\]. For reference, oxygen's ground-state electron configuration is \[1s^22s^22p^4\].

\[\small{1}\]\[\small{10}\]\[\small{100}\]\[\small{1000}\]Binding energy (MJ/mol)Relative number
of electrons\[\small{0}\]
The idealized PES spectrum of oxygen.
In this spectrum, there are three peaks, each representing electrons in a different subshell of oxygen (either \[1s\], \[2s\], or \[2p\]). In terms of binding energy, we would expect the peak with the highest binding energy (the leftmost peak) to correspond to the electrons in the \[1s\] subshell, since these electrons are closer to the nucleus and less shielded than those in the \[2s\] or \[2p\] subshells. The peak with the next highest binding energy must correspond to the \[2s\] subshell, and the peak with the lowest binding energy (the rightmost peak) to the \[2p\] subshell.
We can double-check our peak assignments by considering the intensities of the three peaks: Oxygen's \[2p\] subshell contains twice as many electrons as either the \[1s\] or \[2s\] subshell (\[4\] vs. \[2\]). As a result, we would expect the \[2p\] peak to be twice as intense as either the \[1s\] or \[2s\] peak, which is what we see in the spectrum.
Finally, notice that the peaks corresponding to the \[2s\] and \[2p\] electrons have fairly similar binding energies (both between \[1\] and \[\pu{10 MJ/mol}\]), while the peak corresponding to the \[1s\] electrons has a much higher binding energy (closer to \[\pu{100 MJ/mol}\]). Electrons in the same electron shell have similar energies, so we'd expect to see the peaks representing electrons in the same shell to be grouped together in a PES spectrum. Keeping an eye out for these "groups" can help you distinguish between valence and core electrons in a PES spectrum.
Concept check: How many peaks would you expect in the PES spectrum of neutral calcium?
Identifying an element based on its PES spectrum
A pure sample of an unknown element was analyzed using a photoelectron spectrometer, producing the spectrum shown below. What is the identity of our mystery element?

\[\small{1}\]\[\small{10}\]\[\small{100}\]\[\small{1000}\]Binding energy (MJ/mol)Relative number
of electrons\[\small{0}\]
The idealized PES spectrum of a mystery element!
The PES spectrum shows five peaks, which we would expect to correspond to electrons in the five subshells that are closest to the nucleus: \[1s\], \[2s\], \[2p\], \[3s\], and \[3p\]. The peak with the highest binding energy (the leftmost peak) must correspond to the \[1s\] subshell, while the peak with the lowest binding energy (the rightmost peak) must correspond to the \[3p\] subshell. Note that the \[3p\] peak is half the height of the \[1s\], \[2s\], and \[3s\] peaks, which suggests that there is only \[1\] electron in the \[3p\] subshell of our mystery element.
Which element has only one electron in its \[3p\] subshell? Looking at the periodic table, the first element in the third row of the p-block is aluminum (\[\ce{Al}\]). So, this must be our mystery element! To be sure, let's check that the peaks in the spectrum are consistent with the electron configuration of \[\ce{Al}\], which is \[1s^22s^22p^63s^23p^1\].
As we already know, there are five peaks in the spectrum, which nicely corresponds to the five occupied subshells indicated in aluminum's electron configuration. The intensities of the peaks are consistent with the fact that the \[2p\] subshell contains three times as many electrons as the \[1s\], \[2s\], and \[3s\] subshells and six times as many electrons as the \[3p\] subshell. Finally, we see that there are three regions or groups of peaks in the spectrum, which makes sense considering there are three occupied electron shells in \[\ce{Al}\]. Overall, we can be confident that this spectrum actually does represent aluminum!