The scientific method
Controlled experiments
Introduction
Biologists and other scientists use the scientific method to ask questions about the natural world. The scientific method begins with an observation, which leads the scientist to ask a question. They then come up with a hypothesis, a testable explanation that addresses the question.
A hypothesis isn't necessarily right. Instead, it's a "best guess," and the scientist must test it to see if it's actually correct. Scientists test hypotheses by making predictions: if hypothesis \[\text X\] is right, then \[\text Y\] should be true. Then, they do experiments or make observations to see if the predictions are correct. If they are, the hypothesis is supported. If they aren't, it may be time for a new hypothesis.
How are hypotheses tested?
When possible, scientists test their hypotheses using controlled experiments. A controlled experiment is a scientific test done under controlled conditions, meaning that just one (or a few) factors are changed at a time, while all others are kept constant. We'll look closely at controlled experiments in the next section.
In some cases, there is no good way to test a hypothesis using a controlled experiment (for practical or ethical reasons). In that case, a scientist may test a hypothesis by making predictions about patterns that should be seen in nature if the hypothesis is correct. Then, they can collect data to see if the pattern is actually there.
Controlled experiments
What are the key ingredients of a controlled experiment? To illustrate, let's consider a simple (even silly) example.
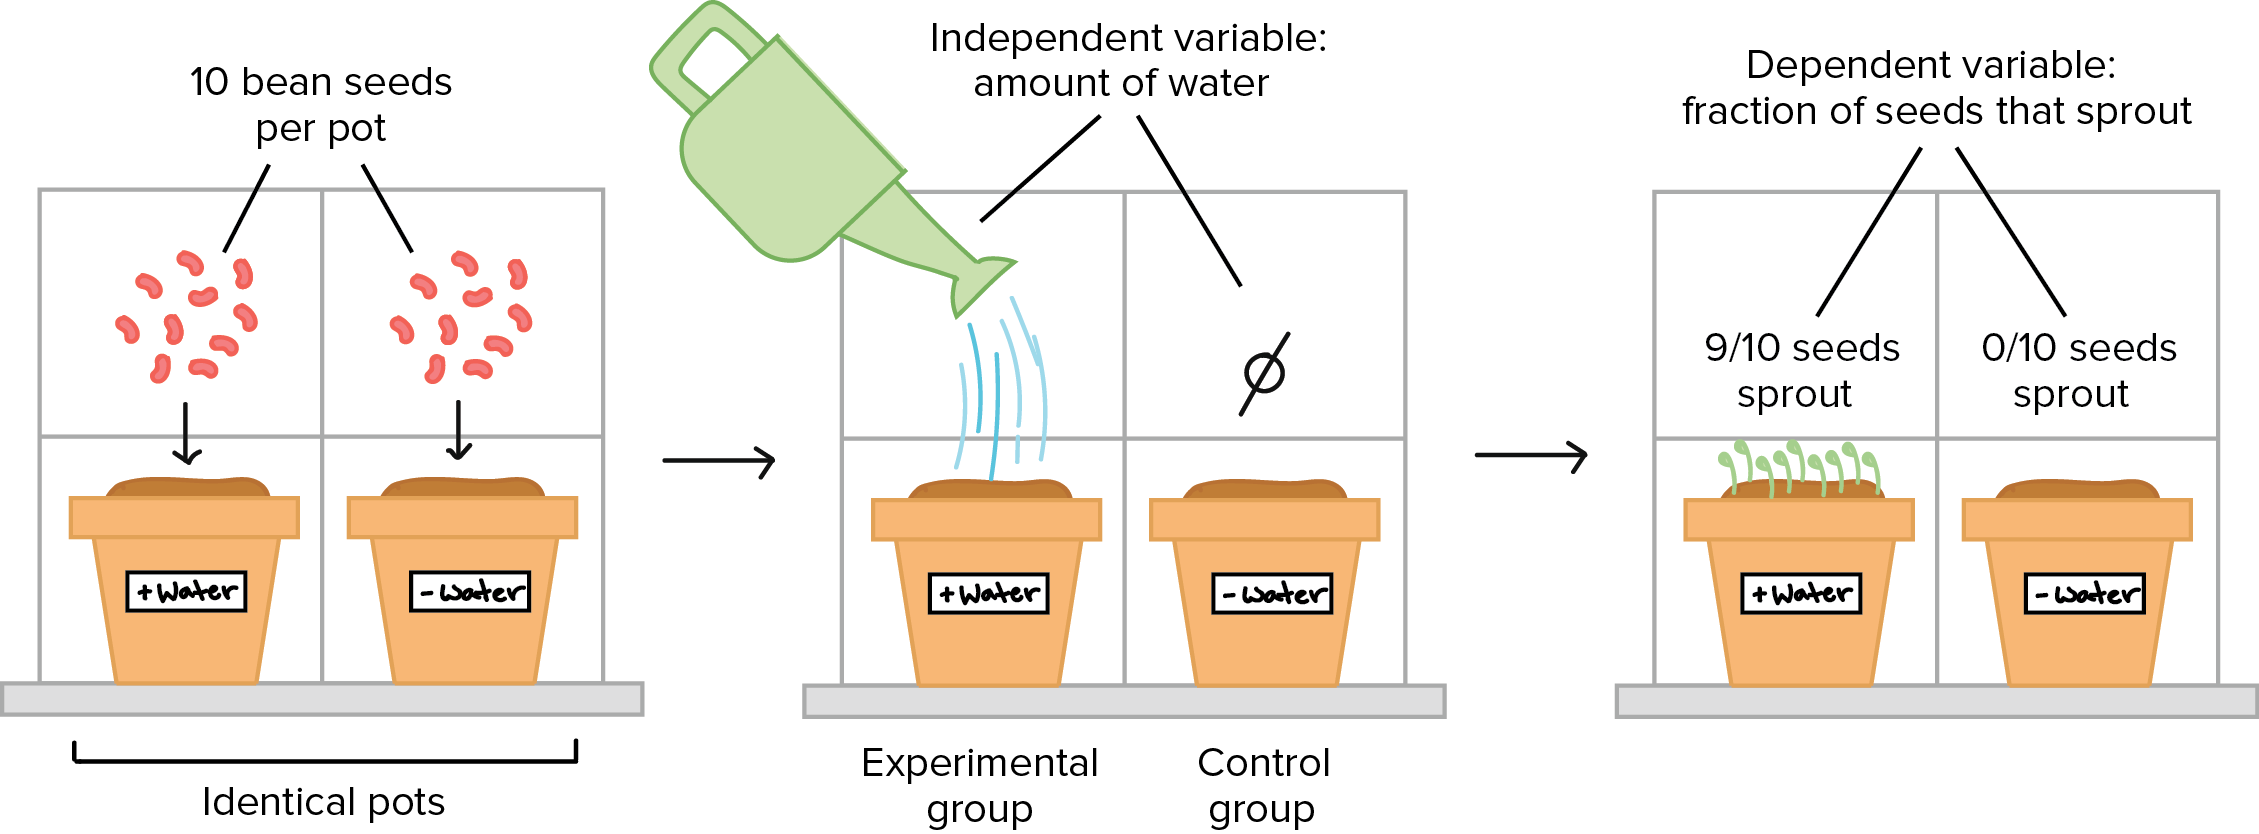
Suppose I decide to grow bean sprouts in my kitchen, near the window. I put bean seeds in a pot with soil, set them on the windowsill, and wait for them to sprout. However, after several weeks, I have no sprouts. Why not? Well...it turns out I forgot to water the seeds. So, I hypothesize that they didn't sprout due to lack of water.
To test my hypothesis, I do a controlled experiment. In this experiment, I set up two identical pots. Both contain ten bean seeds planted in the same type of soil, and both are placed in the same window. In fact, there is only one thing that I do differently to the two pots:
- One pot of seeds gets watered every afternoon.
- The other pot of seeds doesn't get any water at all.
After a week, nine out of ten seeds in the watered pot have sprouted, while none of the seeds in the dry pot have sprouted. It looks like the "seeds need water" hypothesis is probably correct!
Let's see how this simple example illustrates the parts of a controlled experiment.
Control and experimental groups
There are two groups in the experiment, and they are identical except that one receives a treatment (water) while the other does not. The group that receives the treatment in an experiment (here, the watered pot) is called the experimental group, while the group that does not receive the treatment (here, the dry pot) is called the control group. The control group provides a baseline that lets us see if the treatment has an effect.
Independent and dependent variables
The factor that is different between the control and experimental groups (in this case, the amount of water) is known as the independent variable. This variable is independent because it does not depend on what happens in the experiment. Instead, it is something that the experimenter applies or chooses him/herself.
In contrast, the dependent variable in an experiment is the response that's measured to see if the treatment had an effect. In this case, the fraction of bean seeds that sprouted is the dependent variable. The dependent variable (fraction of seeds sprouting) depends on the independent variable (the amount of water), and not vice versa.
Experimental data (singular: datum) are observations made during the experiment. In this case, the data we collected were the number of bean sprouts in each pot after a week.
Variability and repetition
Out of the ten watered bean seeds, only nine came up. What happened to the tenth seed? That seed may have been dead, unhealthy, or just slow to sprout. Especially in biology (which studies complex, living things), there is often variation in the material used for an experiment – here, the bean seeds – that the experimenter cannot see.
Because of this potential for variation, biology experiments need to have a large sample size and, ideally, be repeated several times. Sample size refers to the number of individual items tested in an experiment – in this case, \[10\] bean seeds per group. Having more samples and repeating the experiment more times makes it less likely that we will reach a wrong conclusion because of random variation.
Biologists and other scientists also use statistical tests to help them distinguish real differences from differences due to random variation (e.g., when comparing experimental and control groups).
Controlled experiment case study: \[\text{CO}_2\] and coral bleaching
As a more realistic example of a controlled experiment, let's examine a recent study on coral bleaching. Corals normally have tiny photosynthetic organisms living inside of them, and bleaching happens when they leave the coral, typically due to environmental stress. The photo below shows a bleached coral in front and a healthy coral in back.
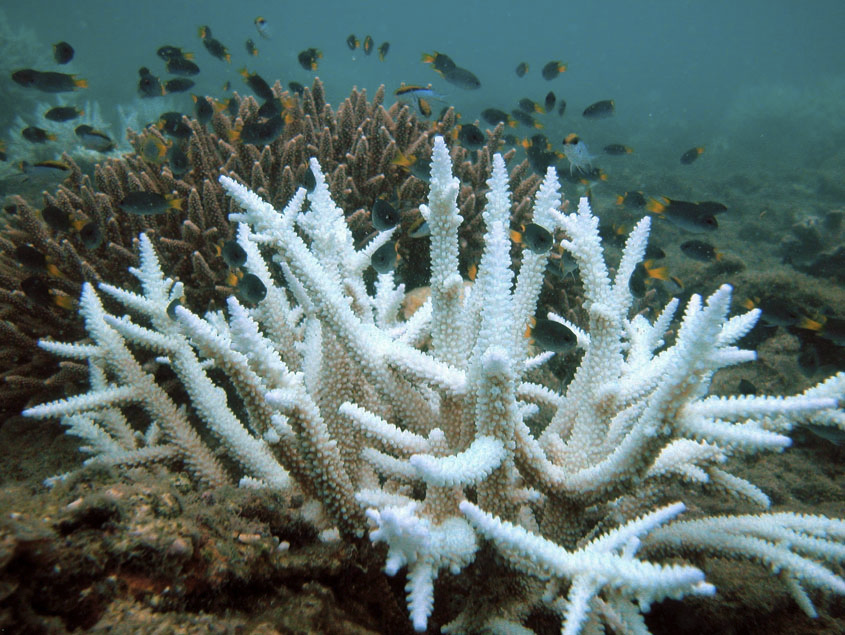
Image credit: "Keppelbleaching" (CC BY 3.0).
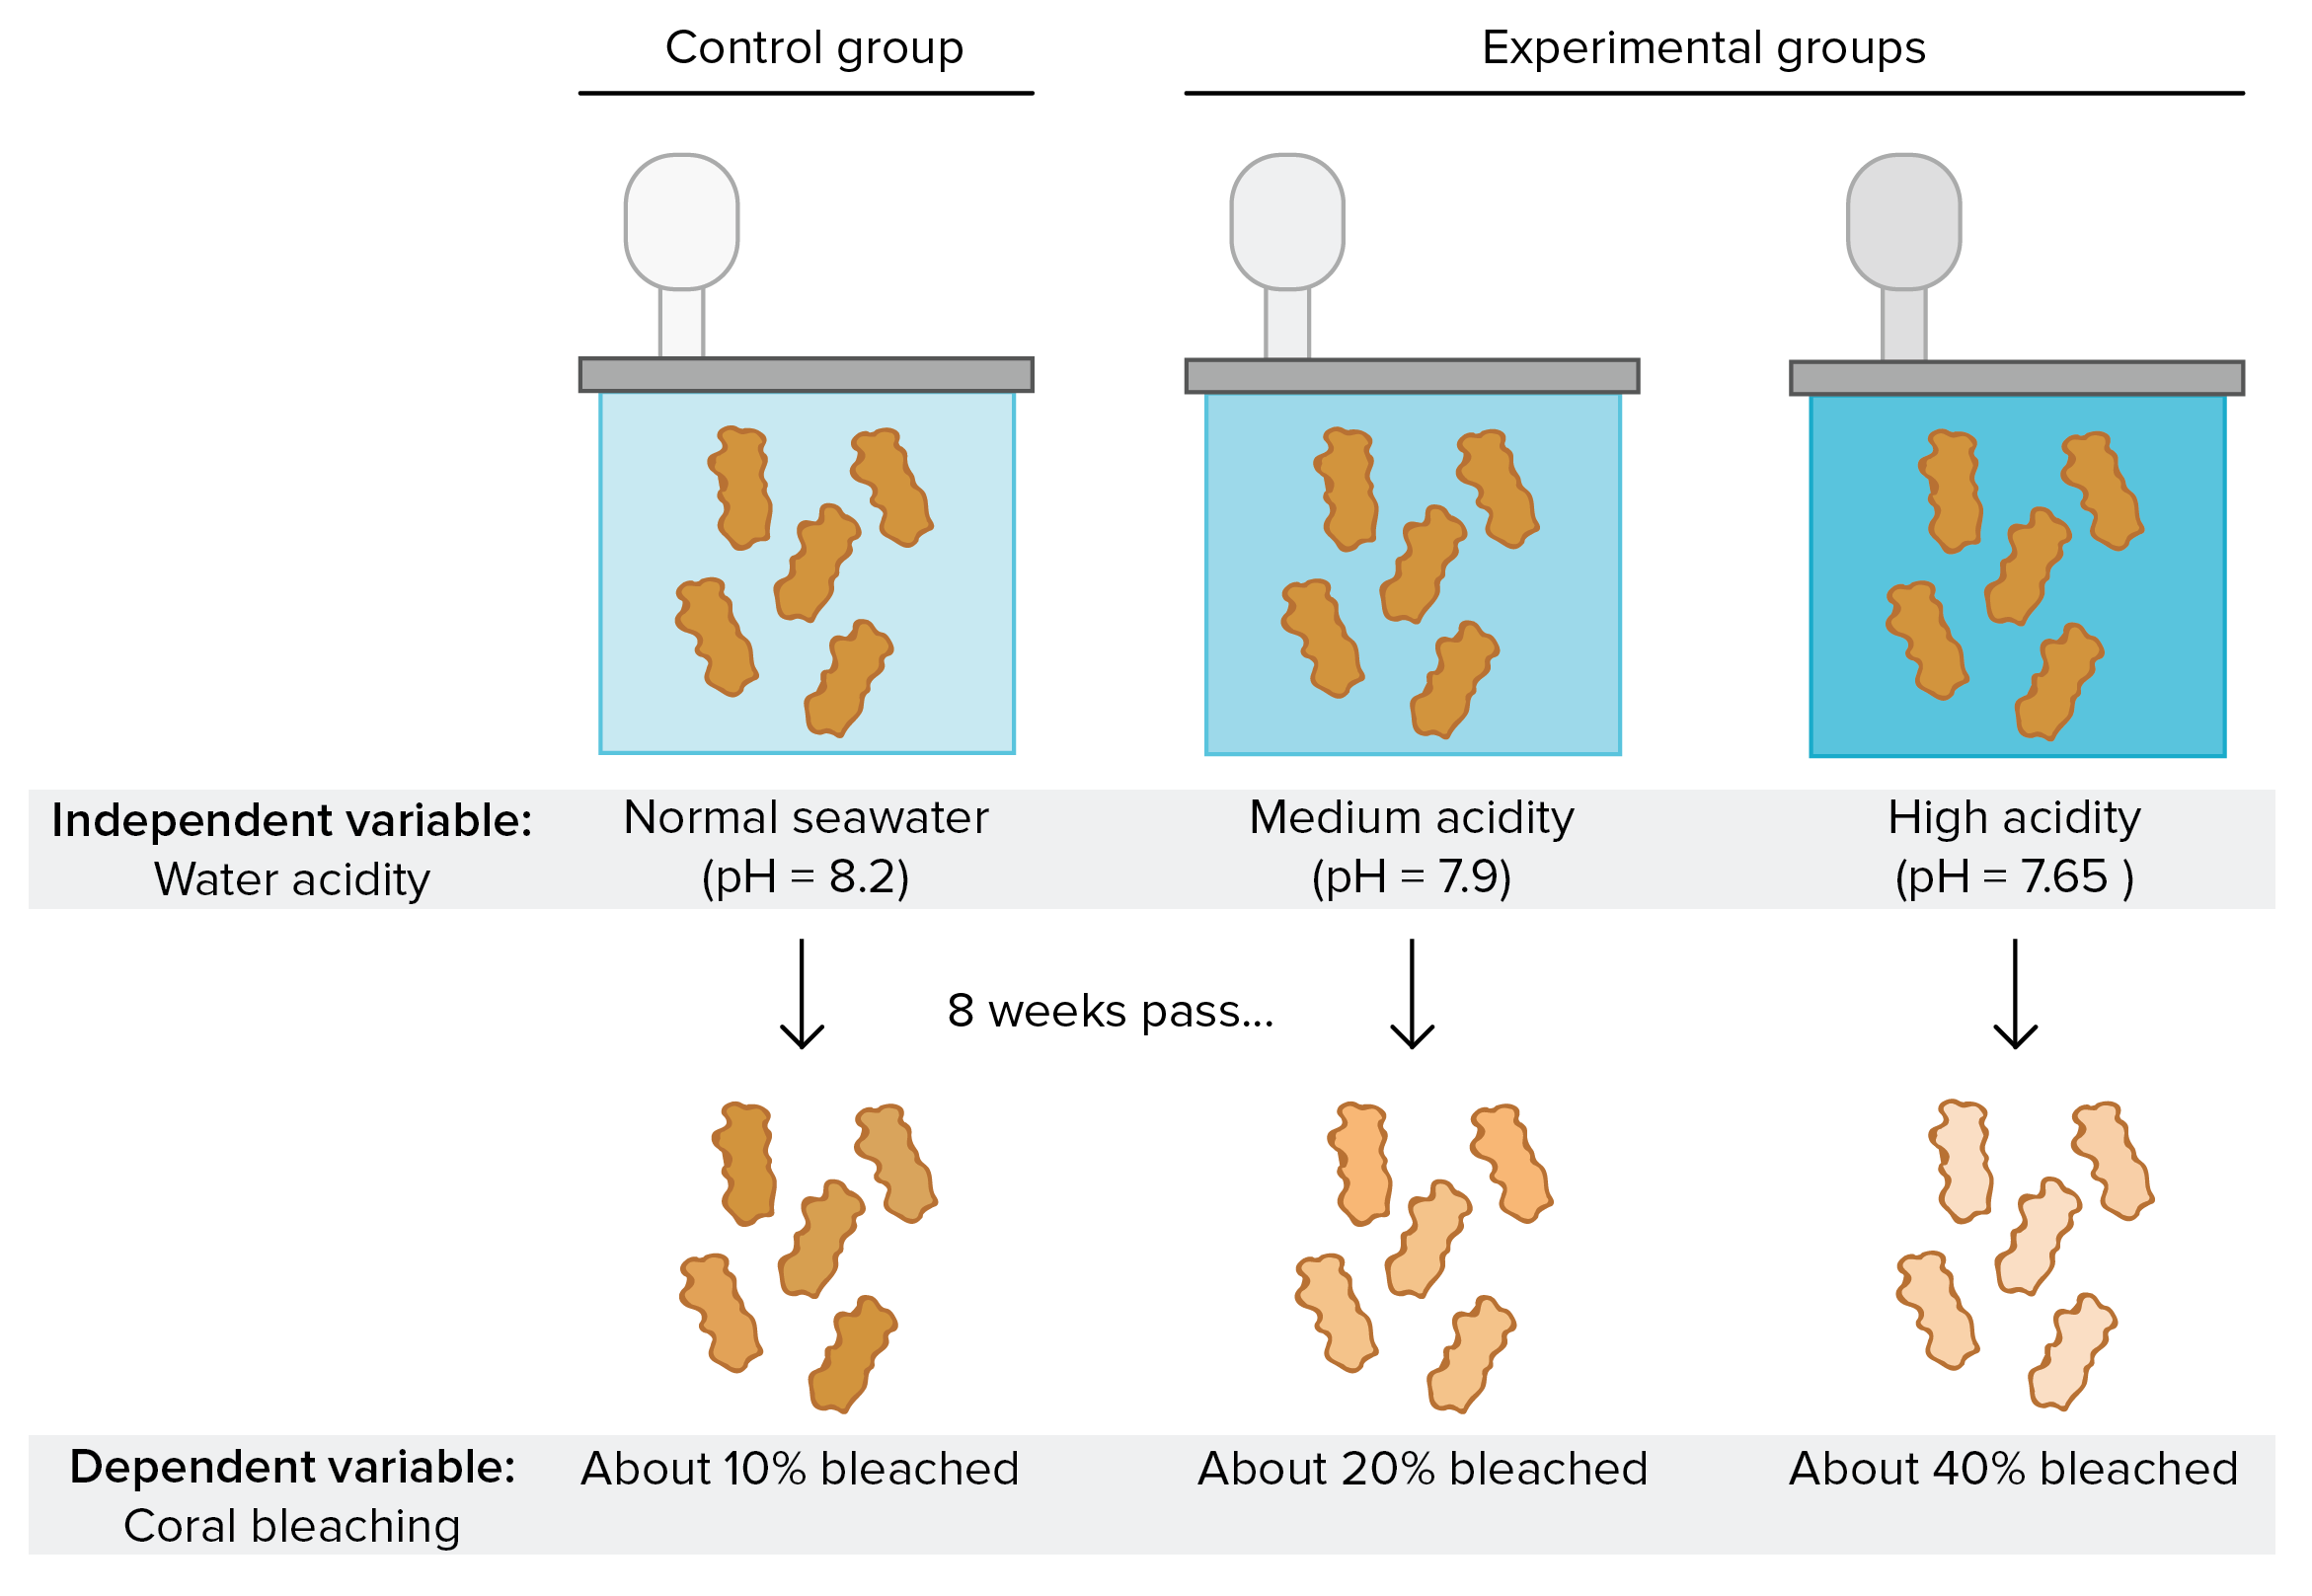
A lot of research on the cause of bleaching has focused on water temperature\[^1\]. However, a team of Australian researchers hypothesized that other factors might be important too. Specifically, they tested the hypothesis that high \[\text{CO}_2\] levels, which make ocean waters more acidic, might also promote bleaching\[^2\].
What kind of experiment would you do to test this hypothesis? Think about:
- What your control and experimental groups would be
- What your independent and dependent variables would be
- What results you would predict in each group
Have you given it a try?
Non-experimental hypothesis tests
Some types of hypotheses can't be tested in controlled experiments for ethical or practical reasons. For example, a hypothesis about viral infection can't be tested by dividing healthy people into two groups and infecting one group: infecting healthy people would not be safe or ethical. Similarly, an ecologist studying the effects of rainfall can't make it rain in one part of a continent, while keeping another part dry as a control.
In situations like these, biologists may use non-experimental forms of hypothesis testing. In a non-experimental hypothesis test, a researcher predicts observations or patterns that should be seen in nature if the hypothesis is correct. They then collect and analyze data, seeing whether the patterns are actually present.
Case study: Coral bleaching and temperature
A good example of hypothesis testing based on observation comes from early studies of coral bleaching. As mentioned above, bleaching is when corals lose the photosynthetic microorganisms that live inside of them, which makes them turn white. Researchers suspected that high water temperature might cause bleaching, and they tested this hypothesis experimentally on a small scale (using isolated coral fragments in tanks)\[^{3,4}\].
What ecologists most wanted to know, however, was whether water temperature was causing bleaching for lots of different coral species in their natural setting. This broader question could not be answered experimentally, as it wouldn't be ethical (or even possible) to artificially change the water temperature surrounding entire coral reefs.
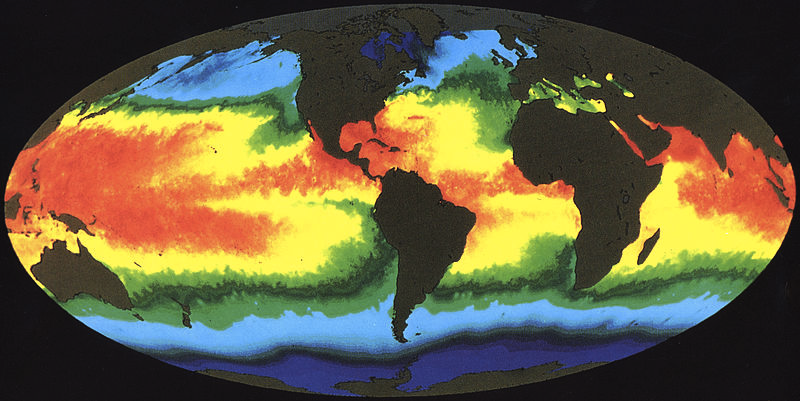
Image credit: "Global sea surface temperature," by NASA (public domain).
Instead, to test the hypothesis that natural bleaching events were caused by increases in water temperature, a team of researchers wrote a computer program to predict bleaching events based on real-time water temperature data. For example, this program would generally predict bleaching for a particular reef when the water temperature in the reef's area exceeded its average monthly maximum by \[1\] \[^\circ \text C\] or more\[^{1}\].
The computer program was able to predict many bleaching events weeks or even months before they were reported, including a large bleaching event in the Great Barrier Reef in 1998\[^{1}\]. The fact that a temperature-based model could predict bleaching events supported the hypothesis that high water temperature causes bleaching in naturally occurring coral reefs.