Enzyme cofactors and coenzymes
Competitive inhibition
Noncompetitive inhibition
Enzyme regulation
Introduction
The cells of your body are capable of making many different enzymes, and at first you might think: great, let’s crank all of those enzymes up and metabolize as fast as possible! As it turns out, though, you really don’t want to produce and activate all of those enzymes at the same time, or in the same cell.
Needs and conditions vary from cell to cell and change in individual cells over time. For instance, stomach cells need different enzymes than fat storage cells, skin cells, blood cells, or nerve cells. Also, a digestive cell works much harder to process and break down nutrients during the time that follows a meal as compared with many hours after a meal. As these cellular demands and conditions changes, so do the amounts and functionality of different enzymes.
Because enzymes guide and regulate the metabolism of a cell, they tend to be carefully controlled. In this article, we’ll take a look at factors that can affect or control enzyme activity. These include pH and temperature (discussed in the active site article), as well as:
Regulatory molecules. Enzyme activity may be turned "up" or "down" by activator and inhibitor molecules that bind specifically to the enzyme.
Cofactors. Many enzymes are only active when bound to non-protein helper molecules known as cofactors.
Compartmentalization. Storing enzymes in specific compartments can keep them from doing damage or provide the right conditions for activity.
Feedback inhibition. Key metabolic enzymes are often inhibited by the end product of the pathway they control (feedback inhibition).
In the rest of this article, we'll examine these factors one at a time, seeing how each can affect enzyme activity.
Regulatory molecules
Enzymes can be regulated by other molecules that either increase or reduce their activity. Molecules that increase the activity of an enzyme are called activators, while molecules that decrease the activity of an enzyme are called inhibitors.
There are many kinds of molecules that block or promote enzyme function, and that affect enzyme function by different routes.
Competitive vs. noncompetitive
In many well-studied cases, an activator or inhibitor's binding is reversible, meaning that the molecule doesn't permanently attach to the enzyme. Some important types of drugs act as reversible inhibitors. For example, the drug tipranivir, which is used to treat HIV, is a reversible inhibitor.\[^1\] It blocks activity of a viral enzyme that helps the virus make more copies of itself.
Reversible inhibitors are divided into groups based on their binding behavior. We won't discuss all of the types here, but we will look at two important groups: competitive and noncompetitive inhibitors.
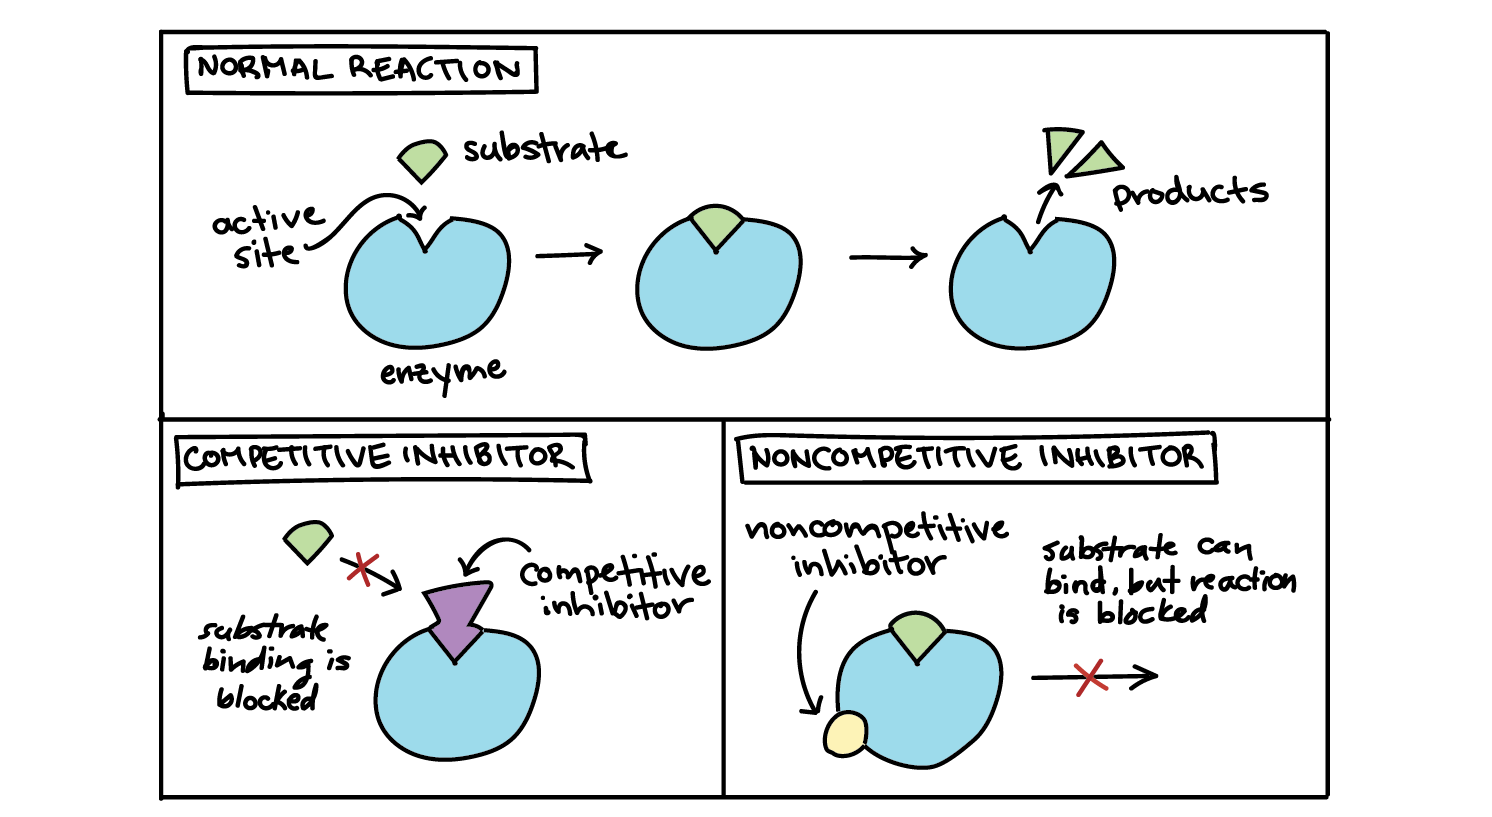
An inhibitor may bind to an enzyme and block binding of the substrate, for example, by attaching to the active site. This is called competitive inhibition, because the inhibitor “competes” with the substrate for the enzyme. That is, only the inhibitor or the substrate can be bound at a given moment.
In noncompetitive inhibition, the inhibitor doesn't block the substrate from binding to the active site. Instead, it attaches at another site and blocks the enzyme from doing its job. This inhibition is said to be "noncompetitive" because the inhibitor and substrate can both be bound at the same time.
Competitive and non-competitive inhibitors can be told apart by how they affect an enzyme's activity at different substrate concentrations.
If an inhibitor is competitive, it will decrease reaction rate when there's not much substrate, but can be "out-competed" by lots of substrate. That is, the enzyme can still reach its maximum reaction rate given enough substrate. In that case, almost all the active sites of almost all the enzyme molecules will be occupied by the substrate rather than the inhibitor.
If an inhibitor is noncompetitive, the enzyme-catalyzed reaction will never reach its normal maximum rate even with a lot of substrate. This is because the enzyme molecules with the noncompetitive inhibitor bound are "poisoned" and can't do their job, regardless of how much substrate is available.
On a graph of reaction velocity (y-axis) at different substrate concentrations (x-axis), you can tell these two types of inhibitors apart by the shape of the curves:
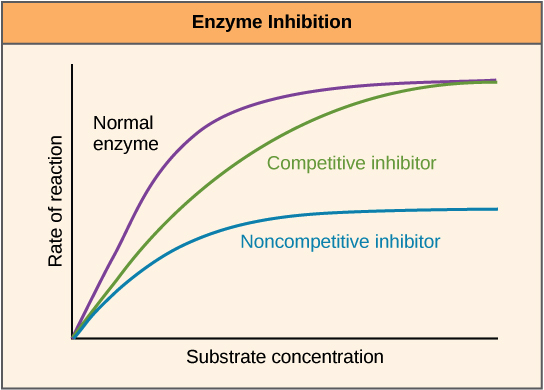
_Image credit: "Enzymes: Figure 3," by OpenStax College, Biology, CC BY 3.0._
Not familiar with this type of graph? No worries! The basics of enzyme kinetics graphs article has a step-by-step walkthrough.
Allosteric regulation
Allosteric regulation, broadly speaking, is just any form of regulation where the regulatory molecule (an activator or inhibitor) binds to an enzyme someplace other than the active site. The place where the regulator binds is called the allosteric site.

_Image modified from "Enzymes: Figure 4," by OpenStax College, Biology, CC BY 3.0._
Pretty much all cases of noncompetitive inhibition (along with some unique cases of competitive inhibition) are forms of allosteric regulation.
However, some enzymes that are allosterically regulated have a set of unique properties that set them apart. These enzymes, which include some of our key metabolic regulators, are often given the name of allosteric enzymes\[^2\]. Allosteric enzymes typically have multiple active sites located on different protein subunits. When an allosteric inhibitor binds to an enzyme, all active sites on the protein subunits are changed slightly so that they work less well.
There are also allosteric activators. Some allosteric activators bind to locations on an enzyme other than the active site, causing an increase in the function of the active site. Also, in a process called cooperativity, the substrate itself can serve as an allosteric activator: when it binds to one active site, the activity of the other active sites goes up.\[^{3}\] This is considered allosteric regulation because the substrate affects active sites far from its binding site.
Cofactors and coenzymes
Many enzymes don’t work optimally, or even at all, unless bound to other non-protein helper molecules called cofactors. These may be attached temporarily to the enzyme through ionic or hydrogen bonds, or permanently through stronger covalent bonds.Common cofactors include inorganic ions such as iron \[\text{(Fe}^{2+})\] and magnesium \[(\text{Mg}^{2+})\]. For example, the enzyme that builds DNA molecules, DNA polymerase, requires magnesium ions to function.\[^4\]
Coenzymes are a subset of cofactors that are organic (carbon-based) molecules. The most common sources of coenzymes are dietary vitamins. Some vitamins are precursors to coenzymes and others act directly as coenzymes. For example, vitamin C is a coenzyme for several enzymes that take part in building the protein collagen, a key part of connective tissue.
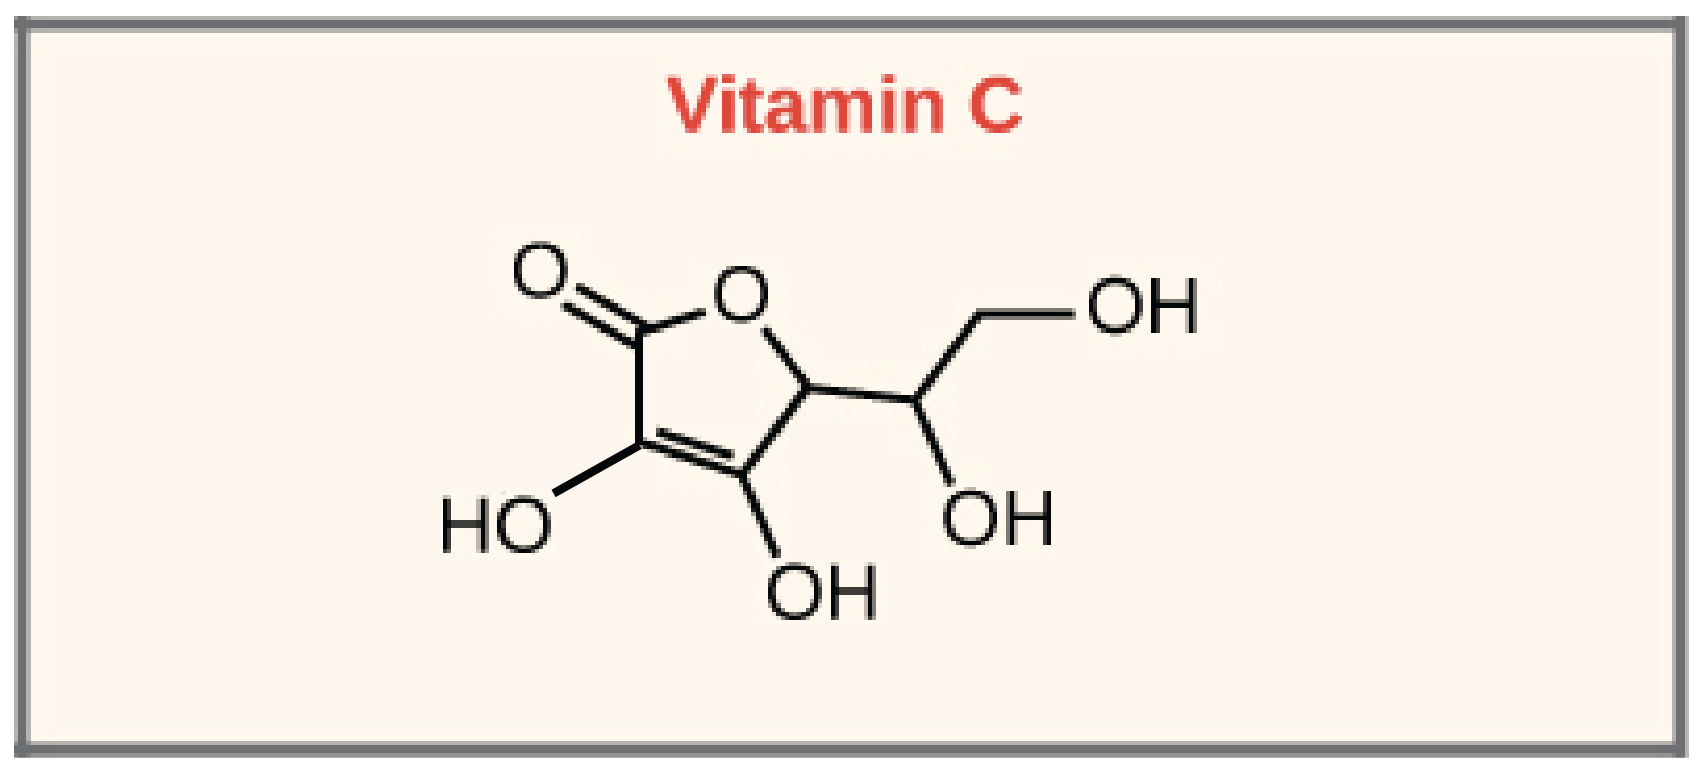
Image modified from OpenStax Biology.
Enzyme compartmentalization
Enzymes are often compartmentalized (stored in a specific part of the cell where they do their job) -- for instance, in a particular organelle. Compartmentalization means that enzymes needed for specific processes can be kept in the places where they act, ensuring they can find their substrates readily, don't damage the cell, and have the right microenvironment to work well.
For instance, digestive enzymes of the lysosome work best at a pH around \[5.0\], which is found in the acidic interior of the lysosome (but not in the cytosol, which has a pH of about \[7.2\]). Lysosomal enzymes have low activity at the pH of the cytosol, which may serve as "insurance" for the cell: even if a lysosome bursts and spills its enzymes, the enzymes will not begin digesting the cell, because they will no longer have the right pH to function.\[^5\]
Feedback inhibition of metabolic pathways
In the process of feedback inhibition, the end product of a metabolic pathway acts on the key enzyme regulating entry to that pathway, keeping more of the end product from being produced.
This may seem odd – why would a molecule want to turn off its own pathway? But it’s actually a clever way for the cell to make just the right amount of the product. When there’s little of the product, the enzyme will not be inhibited, and the pathway will go full steam ahead to replenish the supply. When there’s lots of the product sitting around, it will block the enzyme, preventing the production of new product until the existing supply has been used up.
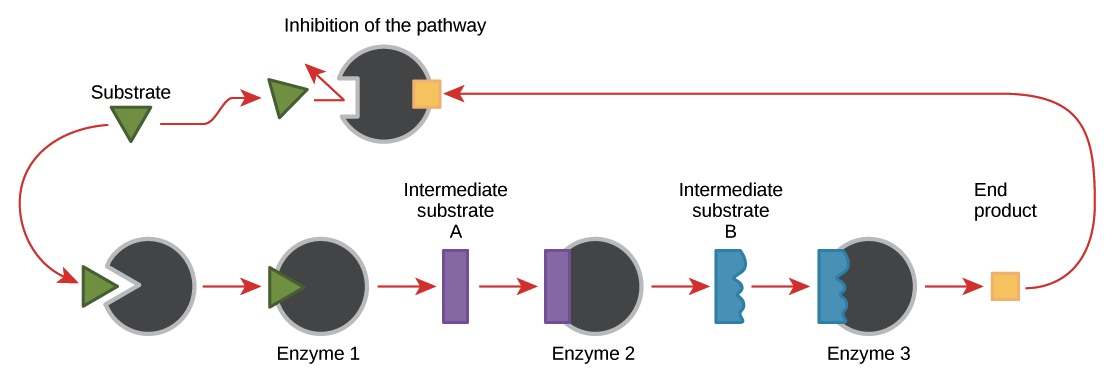
Image credit: OpenStax Biology.
Typically, feedback inhibition acts at the first committed step of the pathway, meaning the first step that’s effectively irreversible. However, feedback inhibition can sometimes hit multiple points along a pathway as well, particularly if the pathway has lots of branch points. The pathway steps regulated by feedback inhibition are often catalyzed by allosteric enzymes.\[^{6}\]
For example, the energy carrier molecule ATP is an allosteric inhibitor of some of the enzymes involved in cellular respiration, a process that makes ATP to power cellular reactions. When there is lots of ATP, this feedback inhibition keeps more ATP from being made. This is useful because ATP is an unstable molecule. If too much ATP were made, much of it might go to waste, spontaneously breaking back down into its components (ADP and P\[_i\]).
ADP, on the other hand, serves as a positive allosteric regulator (an allosteric activator) for some of the same enzymes that are inhibited by ATP. For instance, ADP may act by binding to an enzyme and changing its shape so that it becomes more active.\[^{7}\]
Thanks to this pattern of regulation, when ADP levels are high compared to ATP levels, cellular respiration enzymes become very active and will make more ATP through cellular respiration.
Basics of enzyme kinetics graphs
Introduction
Let’s imagine that you’re in the market for a sports car. What might you want to know about your various options (Ferrari, Porsche, Jaguar, etc.) to decide which one is best? One obvious factor would be how fast the car can go when you floor it. But you might also want more fine-grained information on car’s performance, such as how quickly it can accelerate from 0 to 60 mph. In other words, instead of just knowing its maximum speed, you’d also want to know the kinetics of how the car reaches that speed.
Biochemists tend to feel similarly about the enzymes they study. They want to know as much as possible about an enzyme’s effects on reaction rate, not just how fast the enzyme can go in a flat-out scenario.
As a matter of fact, you can tell a remarkable amount about how an enzyme works, and about how it interacts with other molecules such as inhibitors, simply by measuring how quickly it catalyzes a reaction under a series of different conditions. The information from these experiments is often presented in the form of graphs, so we’ll spend a little time here discussing how the graphs are made (and how to read them to get the most out of them).
Basic enzyme kinetics graphs
Graphs like the one shown below (graphing reaction rate as a function of substrate concentration) are often used to display information about enzyme kinetics. They provide a lot of useful information, but they can also be pretty confusing the first time you see them. Here, we’ll walk step by step through the process of making, and interpreting, one of these graphs.
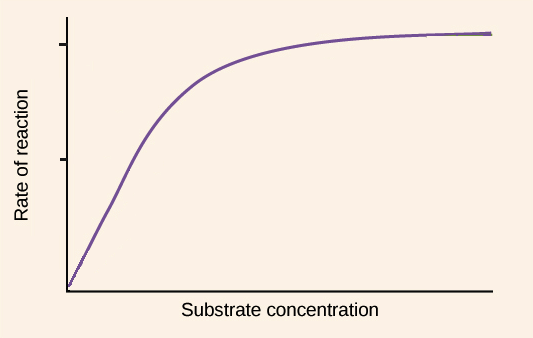
Image modified from "Enzymes: Figure 3," by OpenStax College, Biology (CC BY 3.0).
Imagine that you have your favorite enzyme in a test tube, and you want to know more about how it behaves under different conditions. So, you run a series of trials in which you take different concentrations of substrate - say, 0 M, 0.2 M, 0.4 M, 0.6 M, 0.8 M, and 1.0 M - and find the rate of reaction (that is, how fast your substrate is turned into product) when you add enzyme in each case. Of course, you have to be careful to add the same concentration of enzyme to each reaction, so that you are comparing apples to apples.
How do you determine the rate of reaction? Well, what you actually want is the initial rate of reaction, when you’ve just combined the enzyme and substrate and the enzyme is catalyzing the reaction as fast as it can at that particular substrate concentration (because the reaction rate will eventually slow to zero as the substrate is used up). So, you would measure the amount of product made per unit time right at the beginning of the reaction, when the product concentration is increasing linearly. This value, the amount of product produced per unit time at the start of the reaction, is called the initial velocity, or \[V_0\], for that concentration.
Now, let’s say you’ve found your \[V_0\] values for all your concentrations of interest. You can then plot each substrate concentration its \[V_0\] as an (X, Y) pair. Once you’ve plotted all your (X, Y) pairs for different concentrations, you can connect the dots with a best-fit curve to get a graph. For many types of enzymes, the graph you get will resemble the purple line shown above: the \[V_0\] values will increase rapidly at low substrate concentrations, then level off to a flat plateau at high substrate concentrations.
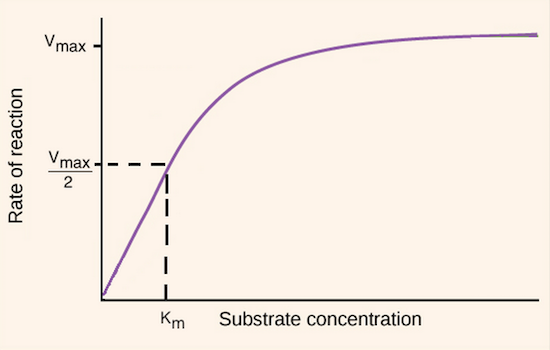
Image modified from "Enzymes: Figure 3," by OpenStax College, Biology (CC BY 3.0).
This plateau occurs because the enzyme is saturated, meaning that all available enzyme molecules are already tied up processing substrates. Any additional substrate molecules will simply have to wait around until another enzyme becomes available, so the rate of reaction (amount of product produced per unit time) is limited by the concentration of enzyme. This maximum rate of reaction is characteristic of a particular enzyme at a particular concentration and is known as the maximum velocity, or \[V_{max}\]. \[V_{max}\] is the Y-value (initial rate of reaction value) at which the graph above plateaus.
The substrate concentration that gives you a rate that is halfway to \[V_{max}\] is called the \[K_m\], and is a useful measure of how quickly reaction rate increases with substrate concentration. \[K_m\] is also a measure of an enzyme's affinity for (tendency to bind to) its substrate. A lower \[K_m\] corresponds to a higher affinity for the substrate, while a higher \[K_m\] corresponds to a lower affinity for the substrate. Unlike \[V_{max}\], which depends on enzyme concentration, \[K_m\] is always the same for a particular enzyme characterizing a given reaction (although the "apparent," or experimentally measured, \[K_m\] can be altered by inhibitors, as discussed below).
Enzyme kinetics graphs and inhibitors
Now, what about inhibitors? We discussed two types of inhibitors, competitive and noncompetitive, in the article on enzyme regulation.
Competitive inhibitors impair reaction progress by binding to an enzyme, often at the active site, and preventing the real substrate from binding. At any given time, only the competitive inhibitor or the substrate can be bound to the enzyme (not both). That is, the inhibitor and substrate compete for the enzyme. Competitive inhibition acts by decreasing the number of enzyme molecules available to bind the substrate.
Noncompetitive inhibitors don’t prevent the substrate from binding to the enzyme. In fact, the inhibitor and substrate don't affect one another's binding to the enzyme at all. However, when the inhibitor is bound, the enzyme cannot catalyze its reaction to produce a product. Thus, noncompetitive inhibition acts by reducing the number of functional enzyme molecules that can carry out a reaction.
If we wanted to show the effects of these inhibitors on a graph like the one above, we could repeat our whole experiment two more times: once with a certain amount of competitive inhibitor added to each test reaction, and once with a certain amount of noncompetitive inhibitor added instead. We would get results as follows:
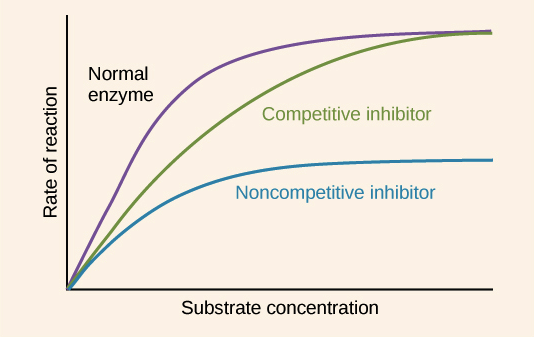
Image modified from "Enzymes: Figure 3," by OpenStax College, Biology (CC BY 3.0).
With a competitive inhibitor, the reaction can eventually reach its normal \[V_{max}\], but it takes a higher concentration of substrate to get it there. In other words, \[V_{max}\] is unchanged, but the apparent \[K_m\] is higher. Why must more substrate be added in order to reach \[V_{max}\]? The extra substrate makes the substrate molecules abundant enough to consistently “beat” the inhibitor molecules to the enzyme.
With a noncompetitive inhibitor, the reaction can never reach its normal \[V_{max}\], regardless of how much substrate we add. A subset of the enzyme molecules will always be “poisoned” by the inhibitor, so the effective concentration of enzyme (which determines \[V_{max}\]) is reduced. However, the reaction reaches half of its new \[V_{max}\] at the same substrate concentration, so \[K_m\] is unchanged. The unchanged \[K_m\] reflects that the inhibitor doesn't affect binding of enzyme to substrate, just lowers the concentration of usable enzyme.
Michaelis-Menten and allosteric enzymes
Many enzymes act similarly to the hypothetical enzyme in the example above, producing parabolic curves when reaction rate is graphed as a function of substrate concentration. Enzymes that display this behavior can often be described by an equation relating substrate concentration, initial velocity, \[K_m\], and \[V_{max}\], known as the Michaelis-Menten equation. Enzymes whose kinetics obey this equation are called Michaelis-Menten enzymes. If you want a more detailed look at the Michaelis-Menten equation and the model underlying it, you may want to check out the Michaelis-Menten videos in the MCAT section.
Michaelis-Menten enzymes are different from allosteric enzymes (discussed in the main article on enzyme regulation). Allosteric enzymes typically have multiple active sites and often display cooperativity, meaning that the binding of a substrate at one active site increases the ability of the other active sites to bind and process substrates.
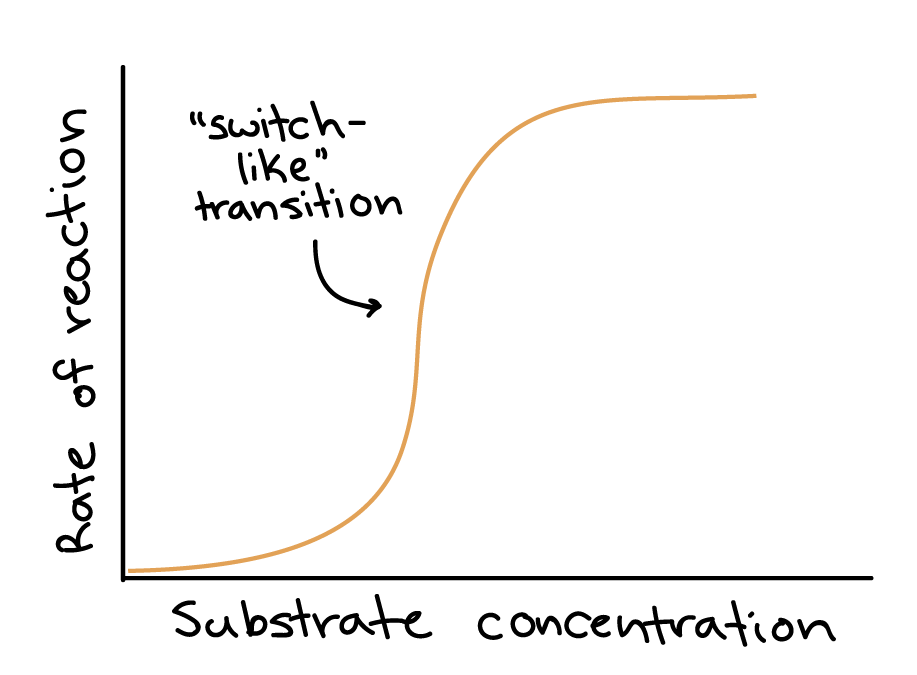
Cooperative enzymes are more sensitive in their response to changes in substrate concentrations than other enzymes and display a “switch-like” transition from low to high reaction rate as substrate concentration increases. This corresponds to a velocity vs. substrate curve that is S-shaped, as shown above.